

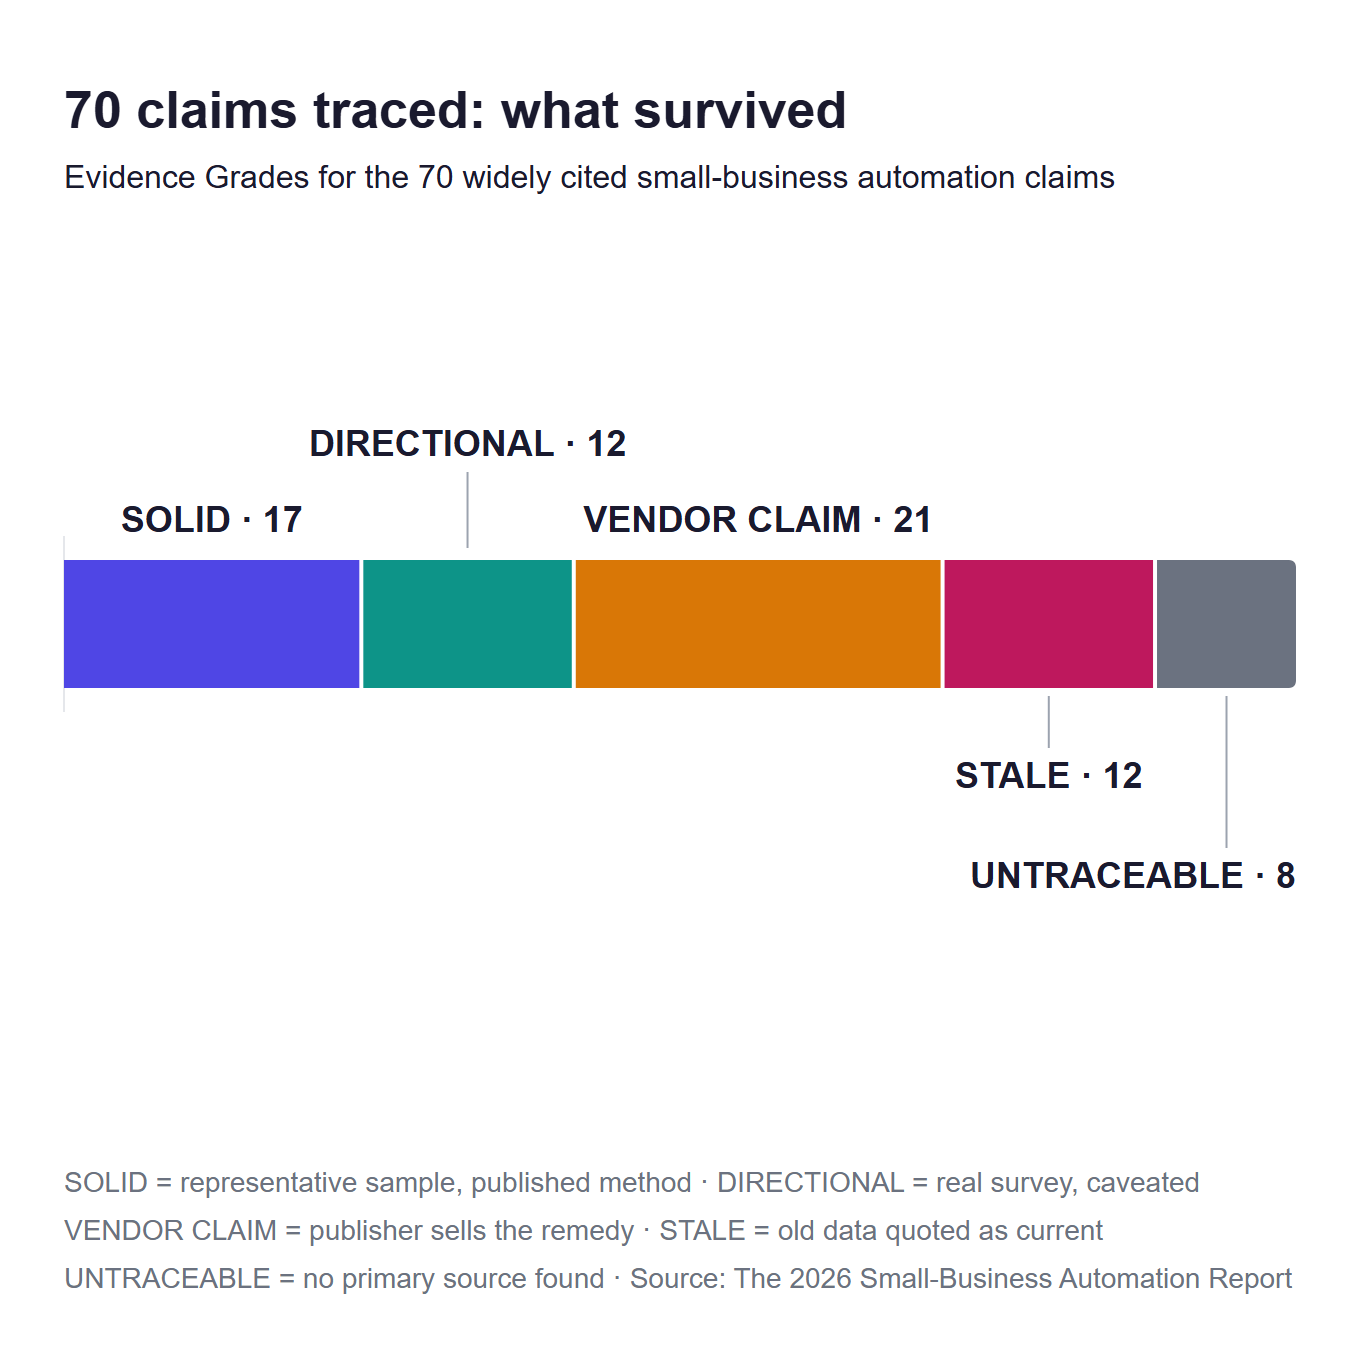
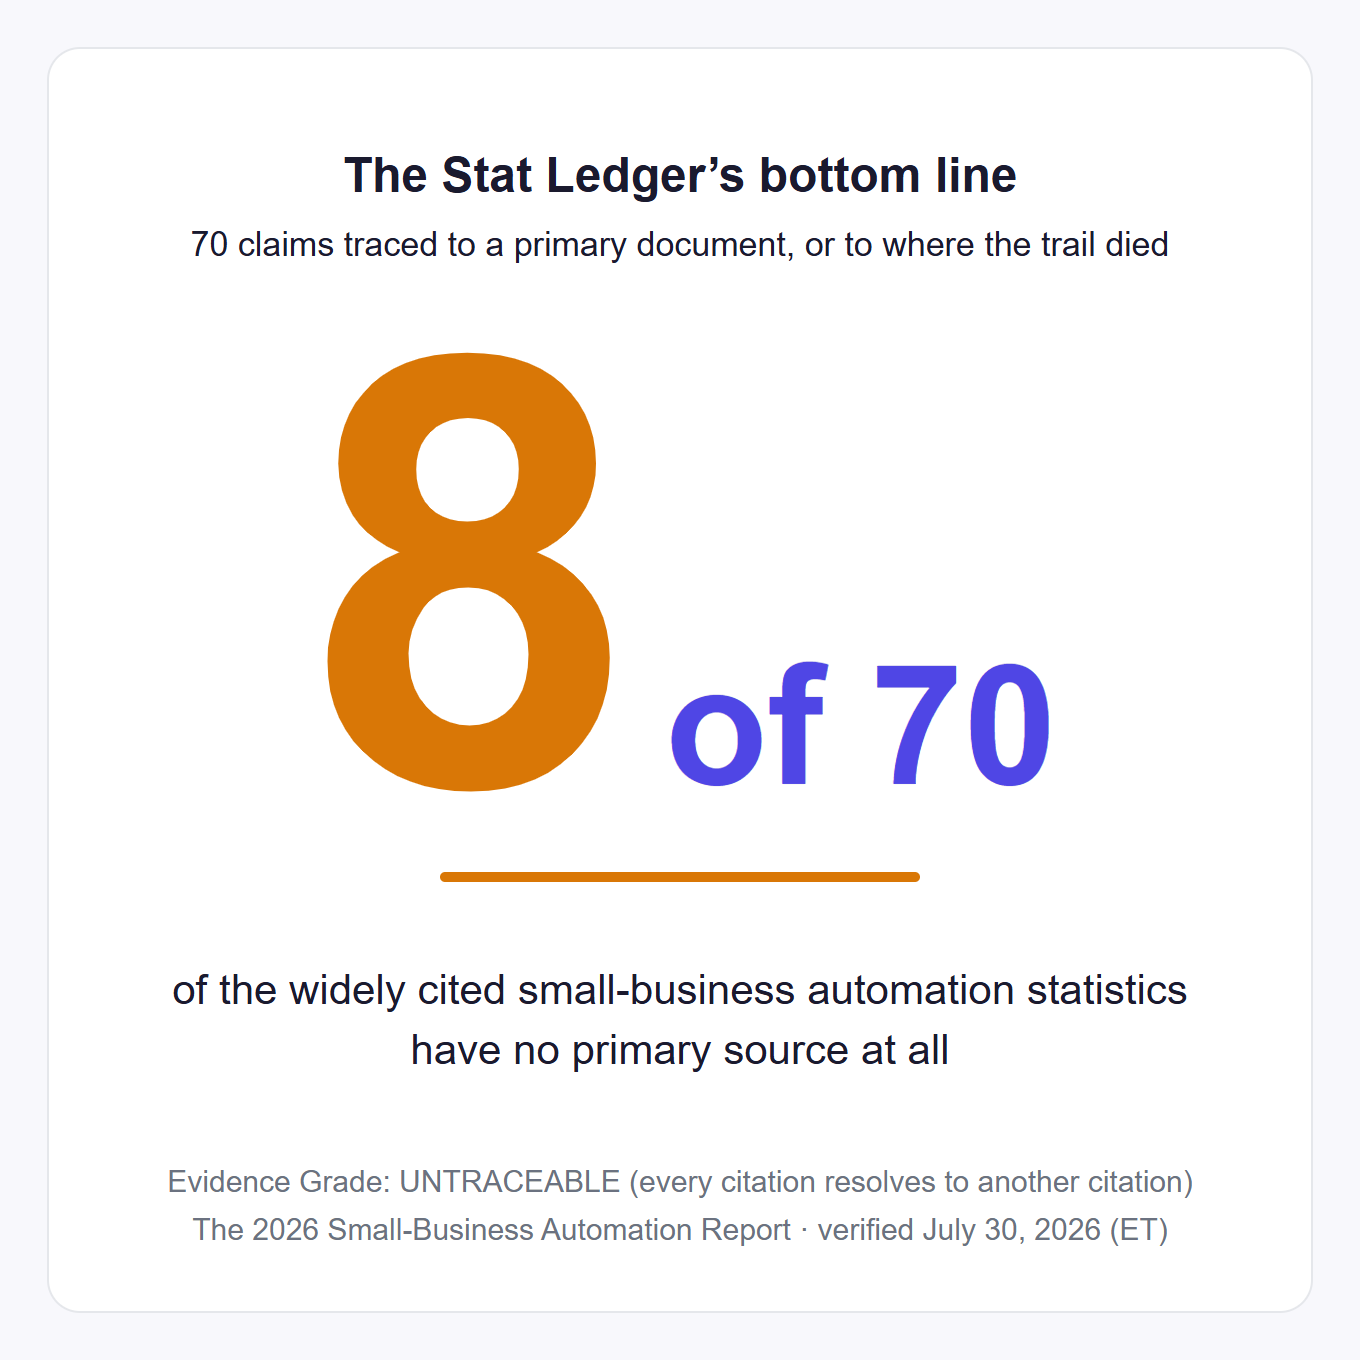
We traced 70 widely cited small-business automation statistics back to their primary sources. Seventeen held up. Eight have no source we could find — including the most-quoted cash-flow statistic on the internet.
Traced means what it sounds like. We fetched the actual PDFs, papers, and press releases behind each number and read what those documents say. When a citation pointed at another citation, we kept following until we hit a real document or ran out of road. Where a trail died, we recorded where it died.
One thing to know up front: we make Praxivara, an AI assistant for small businesses. We sell automation. That is exactly why we graded these numbers hard, including every number that would flatter our own industry. No Praxivara data appears anywhere in this report.
This page exists because the pages that rank for automation statistics almost never cite a study. They cite each other. A 2016 number gets quietly re-dated to 2024. A reader poll from 2006, run by a magazine that no longer exists, still circulates as fact. Twenty-one of the 70 numbers we traced come from a company selling the thing the number justifies. If you write about small businesses, or run one, you deserve a page where every number carries its grade and its primary link. So we built one.
The eight headline findings are next, each one a single sentence built to be quoted. If you came to check one number, skip to the complete 70-row ledger, where every claim sits beside its grade and its source.
The eight headline findings
Each finding below is one sentence you can lift whole, with its own anchor so you can cite it directly. The receipts live in the five audit sections and the 70-row ledger further down.
Eight findings from 70 traced claims
- 8 of the 70 widely cited small-business automation statistics have no primary source at all, including "82% of small businesses fail because of cash flow," for which we found no supporting primary study. That claim and the seven other ghosts grade UNTRACEABLE; the full 82% trace is at ledger row C1.
- Only 17 of 70, about 1 in 4, trace to a solid primary source that still says what the statistic claims. The other 53 carry a caveat, a vendor, a stale date, or nothing at all.
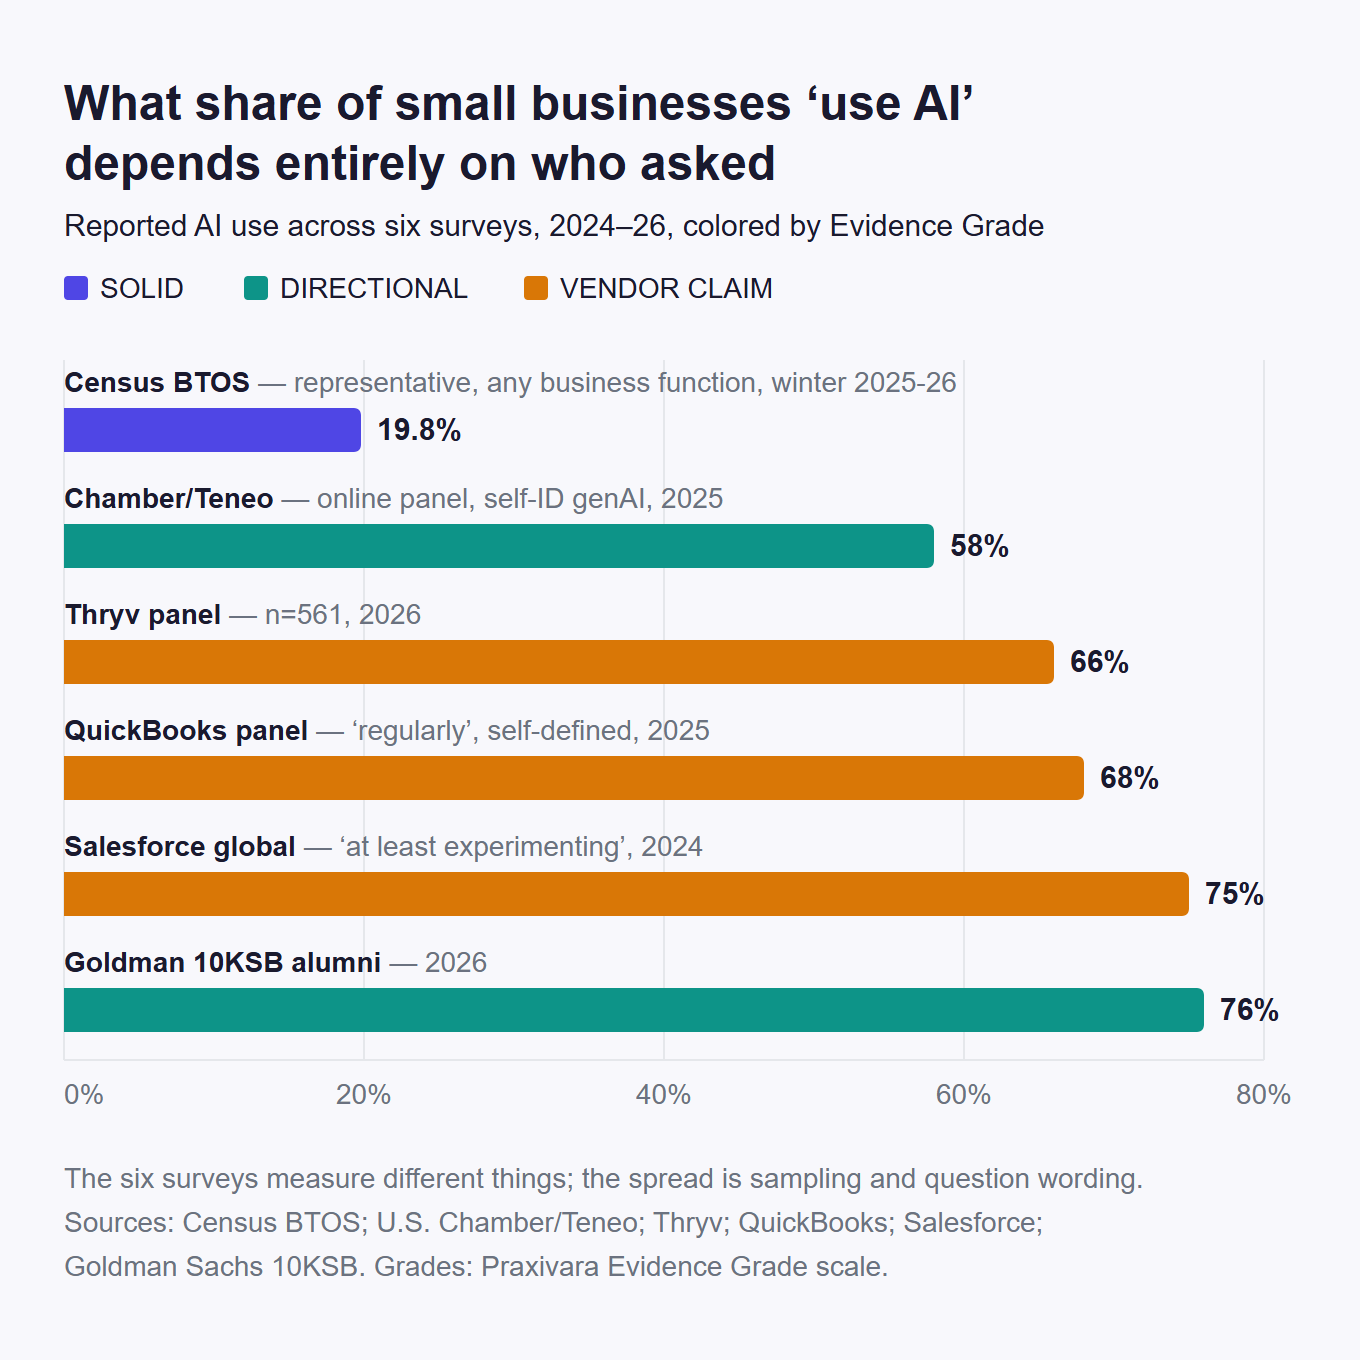
- Depending on who asked, "small businesses using AI" in 2025-26 runs from roughly 20% in Census's representative survey to 76% among alumni of a Goldman Sachs accelerator. The spread is explained entirely by who was surveyed and how the question was worded.
- 21 of the 70 numbers grade VENDOR CLAIM, meaning they come from a company selling the thing the number justifies, and every "hours saved per week" headline we traced leads back to a seller's own survey. The universal "13 hours a week," a scheduling vendor's "7.6 hours of focus time," and a virtual-assistant firm's "36% of the workweek" all fit the pattern.
- The "current" statistics are old: "62% of calls go unanswered" is a 2016 study of 85 businesses, the "$825 billion in unpaid invoices" is a 2016 estimate, the "27 cash buffer days" is 2015 data, and the "52-hour owner workweek" dates to 2005. All four still circulate undated.
- The analyst firm behind "98% of texts are read" has publicly retired its own number, and its updated estimate is about 55%. The retraction appears in none of the vendor pages still quoting the 98%.
- Statistics mutate as they travel: a 2016 Fundbox estimate now circulates credited to "QuickBooks 2024," a five-minute lead-response study by a sales-software vendor circulates as "an MIT study," and one page-one listicle attributes to the Census Bureau a number five times higher than the Census figure.
- The strongest numbers are the least quoted: the Federal Reserve's finding that roughly 4 in 5 small firms face payment challenges, Xero's ledger-measured 28.8 days to get paid, and the randomized-trial evidence that reminders cut no-shows by about a third. All three grade SOLID.
Download the full report as a PDF — free, no email, no form. Prefer raw data? Download the full ledger as CSV.
The Evidence Grade: how we scored every number
Every one of the 70 statistics in this report got the same treatment. We found the primary document behind the claim, fetched it, read what it actually says, and graded the result on a five-grade scale: the Evidence Grade. The grade travels with the stat. A number's Evidence Grade is part of the number.
SOLID looks like the Census Bureau's Business Trends and Outlook Survey. The sample is representative and the method is published. The document says what people quote from it. Its winter 2025-26 data puts AI use at roughly 18-20% of U.S. employer firms.
DIRECTIONAL looks like the U.S. Chamber of Commerce's 58% generative-AI figure. The survey is real and named. But it ran on an online opt-in panel for an advocacy publisher, and it runs about three times the representative Census rate for the same period. The caveat changes the meaning, so the caveat rides in the same sentence.
VENDOR CLAIM looks like Reclaim.ai's claim that its scheduling tool saves users 7.6 hours of focus time a week. The number sits on the company's marketing homepage with no methodology anywhere. Reclaim sells the thing the number justifies.
STALE is the famous 27 cash buffer days. The JPMorgan Chase Institute study behind it is a landmark, built on 597,000 real business accounts — and on 2015 data, which almost nobody quoting it mentions.
And UNTRACEABLE is "82% of small businesses fail because of cash flow." Every citation resolves to another citation. We could not find any study behind it.
The position behind all this grading is blunt: a statistic without its grade is not information. "According to a study" with no fetchable study is a rumor with a suit on.
One honest calibration: the grades judge the evidence, not the people. A vendor survey can be well run. QuickBooks' late-payments series publishes its methodology every year and still grades VENDOR CLAIM, because the publisher sells the remedy. Advocacy groups advocate. That is a caveat, not a scandal.
The Evidence Grade
- SOLID. A primary source exists, we fetched it, the method is stated, and the document says what the stat claims. Cite freely, with source and year.
- DIRECTIONAL. Real, named research with a caveat that changes the meaning: a commissioned sample, an advocacy sponsor, a modeled estimate, or a definition narrower than the quote. Cite only with the caveat in the same sentence.
- VENDOR CLAIM. The number comes from a company selling the thing the number justifies. Cite only as "according to [vendor]," with the year.
- STALE. A real primary exists, but the number is old enough to mislead without its date. Cite only with the year stated in the text.
- UNTRACEABLE. We could not locate any primary document. Every citation resolves to another citation. Do not cite it at all.
Writers are welcome to use these grades. The methodology section explains how to cite the scale.
So what grade does the most-quoted adoption number get?
How many small businesses actually use AI?
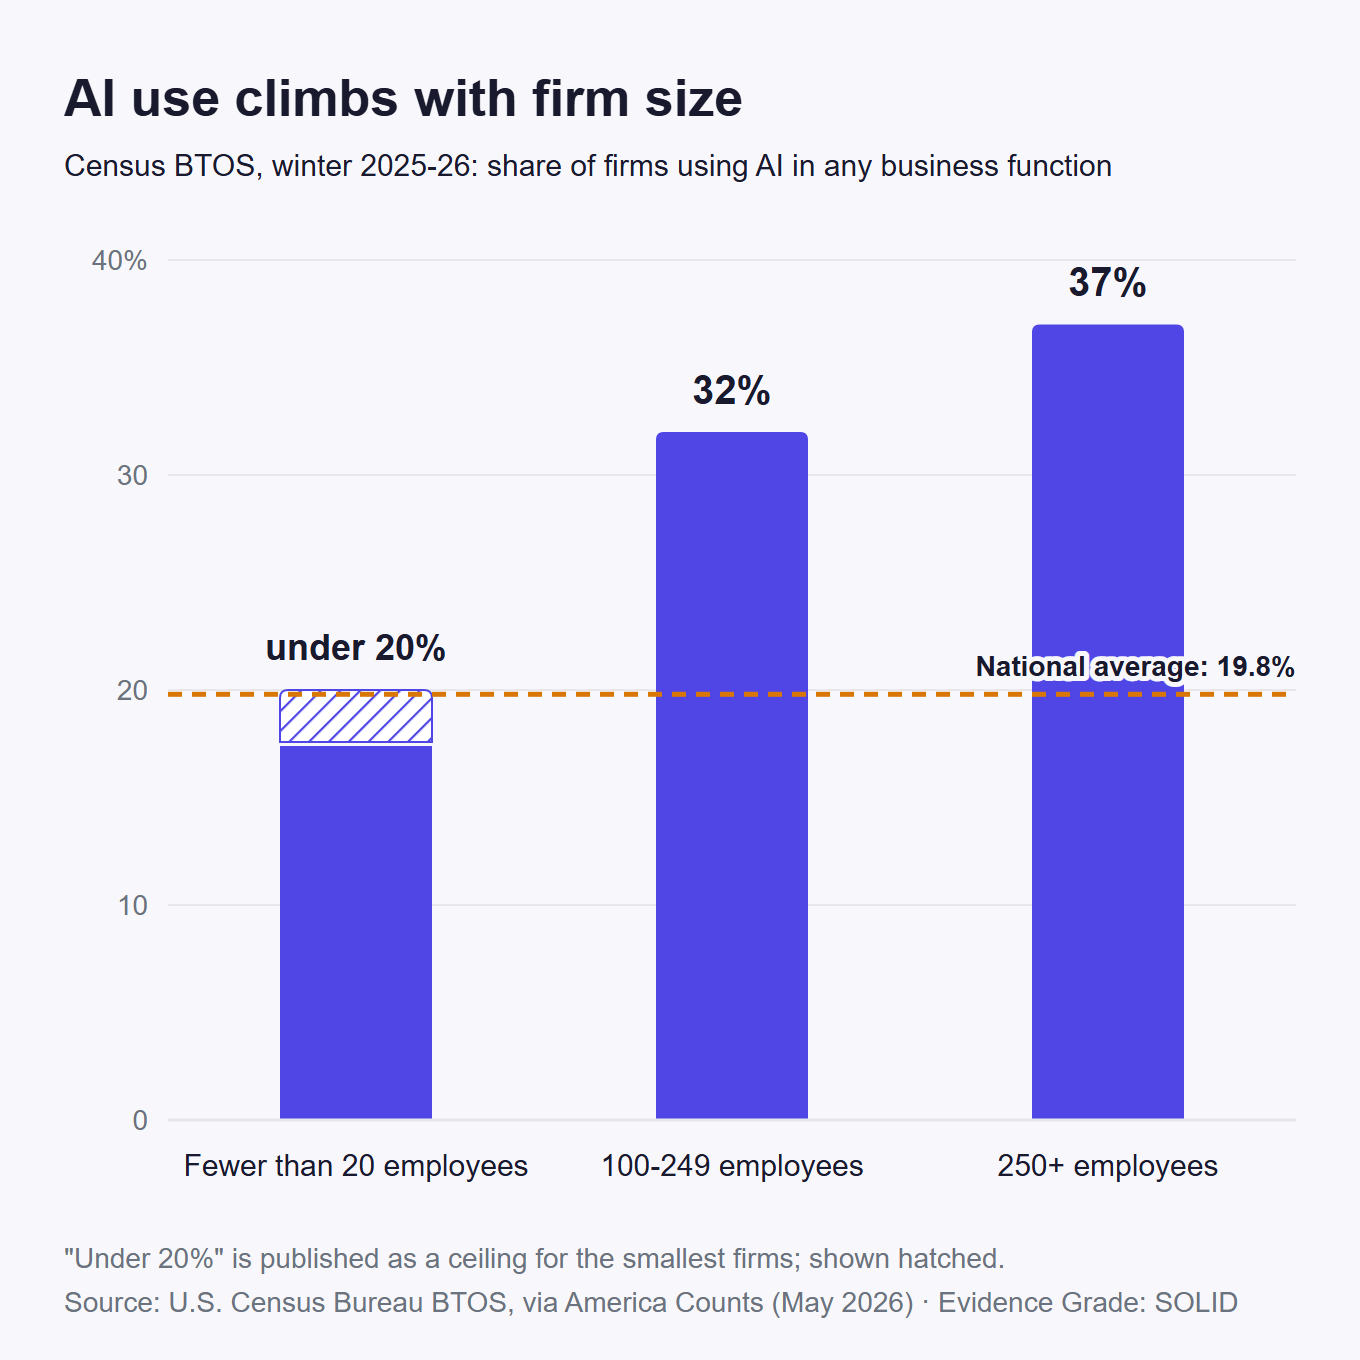
Representative Census data (winter 2025-26) puts AI use at roughly 18-20% of U.S. small employers, and under 20% for firms with fewer than 20 employees. Vendor and advocacy surveys report 58-76% because they poll self-selected, tech-engaged panels with looser definitions. Both are real measurements of different things.
The low end is the only SOLID measurement of the adoption rate itself. Census's Business Trends and Outlook Survey draws a representative sample of employer firms and publishes its method. Its winter 2025-26 waves put AI use in any business function at roughly 18-20%, with 19.8% in the latest reading. Size drives the rate: 37% of firms with 250 or more staff use AI, and under 20% of firms below 20 staff do. One warning before anyone draws a trend line. Before November 2025, the same survey asked a narrower question, AI used in producing goods or services, and found 3.7% to 5.4% over winter 2023-24. That production-only series was retired. It is not an earlier point on today's curve, so never splice the two.
The high end comes apart one grade at a time. The Chamber of Commerce and Teneo's 2025 online survey (n=3,870) found 58% self-identifying as generative-AI users. That is about three times the representative Census rate for the same period, from an opt-in panel published by an advocacy group: DIRECTIONAL. Intuit QuickBooks' commissioned April 2025 panel found 68% using AI "regularly," a term left for the respondent to define: VENDOR CLAIM. The same series jumped 20 points in nine months, a move no representative series shows. Salesforce's 2024 global survey of 3,350 SMB leaders found 75% "at least experimenting," a bar one ChatGPT trial clears, among firms up to 200 employees: VENDOR CLAIM. So is the same release's 91% "AI boosts revenue," a perception question asked only of adopters. And marketing-software vendor Thryv's 561-respondent panel found 66%: VENDOR CLAIM.
The cluster's biggest number has the narrowest room. Goldman Sachs reported 76% AI use in early 2026 among alumni of its own small-business accelerator, an unusually growth-minded group. The same release notes that only 14% call AI fully embedded in the business. Real survey, specific population: DIRECTIONAL. None of these surveys is fake. They are different questions, asked of different rooms, and the spread between 20% and 76% is sampling and wording, not contradiction.
Two chains in this cluster are worth walking end to end.
First, the 98%. In a 2024 Chamber/Teneo survey, 98% of small businesses used at least one everyday tool with AI somewhere inside it. The report's own page 18 shows what counted: spam filters, smartphone cameras, Netflix, and lane-centering cruise control. The meaningful figure in the same survey was 40% self-reported generative-AI use, up from 23% in 2023, which at least measures a deliberate choice; it comes from an online advocacy panel, so DIRECTIONAL. The 98% went on to be deployed verbatim in advocacy against state AI regulation. It grades VENDOR CLAIM.
Second, the 13 hours. "AI saves small business owners 13 hours a week" appears across roundups as settled fact. We could not find any study that states it as written. The nearest ancestor is a three-day, 676-respondent advocacy poll from October 2023 that asked its 507 self-identified AI users to estimate their own savings. Each retelling hop strips a qualifier — adopters-only becomes all owners, and self-estimate becomes measurement. The claim grades UNTRACEABLE. The same poll is also the source of the "$273.5 billion saved annually" headline, which is the sponsor's own economist scaling those self-reports to the whole economy. VENDOR CLAIM, and a dollar figure we recommend against repeating.
And the McKinsey pair, quoted with more confidence than it was written. McKinsey's 2017 model estimated that about 50% of paid work activities were technically automatable, and that under 5% of occupations could be automated entirely. Both figures are SOLID, and both are 2017 capability estimates, not forecasts of what will happen. The citation chain degrades them in two steps: "activities" becomes "jobs," and "potential" becomes "will." Neither swap survives a read of the actual report.
How much time owners really lose to admin
Of the twelve widely cited admin-time statistics, not one earned a SOLID. The whole genre runs on vendor surveys, tiny advocacy polls, and numbers old enough to vote. Every famous figure about owner hours and tax time sits in the weakest cluster of this report.
Start with the oldest ghost. "Owners work twice as much as their employees" traces to a reader poll in the New York Enterprise Report, a magazine that no longer exists. The poll ran in early 2006. The sample size was never published. Twenty years later, the line circulates credited to SCORE, because a SCORE blog once repeated it. That is the entire chain. UNTRACEABLE.
The honest long-hours number is old and says so. A 2005 Wells Fargo/Gallup poll of 607 owners found an average 52-hour workweek, with 62% working 50 hours or more. That is real probability polling from the pre-smartphone economy, which makes it STALE: usable, but only with its year attached.
The tax-time numbers show how attribution gets laundered. The line "40% of small businesses spend 80-plus hours a year on taxes, according to SCORE" was never a SCORE survey. SCORE's 2015 infographic republished NSBA's 2014 member survey without credit, and the SCORE label stuck. NSBA's own 2025 wave of 625 owners puts the 80-plus-hour share at 24%, so the popular quote overstates today's number by two-thirds. Both figures grade DIRECTIONAL: credit NSBA, and name the wave year, because the distribution moves.
Two of the biggest headlines describe a whole company, not an owner. Sage's 2017 study across 11 countries put admin at about 5% of a firm's total staff hours, roughly 120 person-days a year spread across everyone on payroll. Quoted as the owner personally losing 120 days, it would swallow half a working year. Starling Bank's "15 hours a week on financial admin" is per business too: 15 of 79 combined weekly hours, measured in UK micro-firms only, in a 2019 survey the bank paid for. Both grade VENDOR CLAIM.
The per-firm trap: the two biggest admin-time headlines count the whole company's hours, not the owner's. Before repeating one, check whose time the study measured.
Then there is the fake-precision tier. The Alternative Board, a peer-advisory franchise, polled its own member network in 2016 and reported owners working 49.4 hours a week, split 68.1% "in" the business and 31.9% "on" it. One-decimal precision, sample size never published. VENDOR CLAIM. A 2023 poll of 251 entrepreneurs, paid for by a virtual-assistant company, puts admin at about a third of the workweek; the "Forbes" article citing it is the sponsor's own CEO's contributor column. VENDOR CLAIM again. Even the respectable email figure wobbles: McKinsey's "28% of the workweek on email" is from 2012, describes corporate "interaction workers" rather than owners, and rests on an IDC survey never published in detail. DIRECTIONAL, and never convert it into an hour count.
The pattern across all twelve is steady. Every number in this cluster that sounds current is either old, per-firm, or sold by someone. The ledger below carries each one, with its grade and its year.
The cash-flow and invoice numbers
The most widely circulated cash-flow statistic on the internet has no source. “82% of small businesses fail because of cash flow problems” appears in thousands of articles, almost always credited to a U.S. Bank study by way of SCORE. We went looking for the study. We could not find it.
The paper trail is short, and it goes nowhere. U.S. Bank’s site has nothing. SCORE’s own statistics pages, archived in 2003 and again in 2011, never carried the number. The most-shared “source” link resolves to SCORE’s homepage, not a document. Attributions cannot even agree on which decade the study supposedly ran. One 2026 listicle now cites a full study title that appears nowhere else on the internet. Even sympathetic retellings quietly soften “fail because of” to “contributed to,” which is a different claim. Everyone cites SCORE; SCORE cites the ghost. The grade is UNTRACEABLE, and the whole chain is documented at its ledger row.
One famous failure number survives the trace: on BLS administrative data covering essentially every private-sector employer, about half of new business establishments close within five years, a share that has barely moved in three decades, and it grades SOLID at its ledger row. The same table refutes the “half fail in the first year” variant, which is really about 1 in 5, and BLS counts every exit, sales and retirements included, so “close” is the honest verb.
If you need a real number about cash-flow pain, Intuit’s 2026 QuickBooks survey has one, and it publishes its methodology: 1,305 owners plus quarterly waves. In it, 39% of owners said a single late payment made payroll or bills hard to cover in the past year. It is a VENDOR CLAIM, since Intuit sells invoicing software, so name the source every time you cite it.
This cluster’s second exposé is number laundering, caught in the act. In 2016, Fundbox, an invoice-financing company, estimated that US small businesses were owed $825 billion in unpaid invoices. The estimate was projected from 39 million invoices on the lender’s own platform, meaning its own cash-strapped customer base. A decade later, 2026 listicles credit the same figure to “QuickBooks/Intuit research, 2024”. The grade is STALE, and the relabeling is the finding.
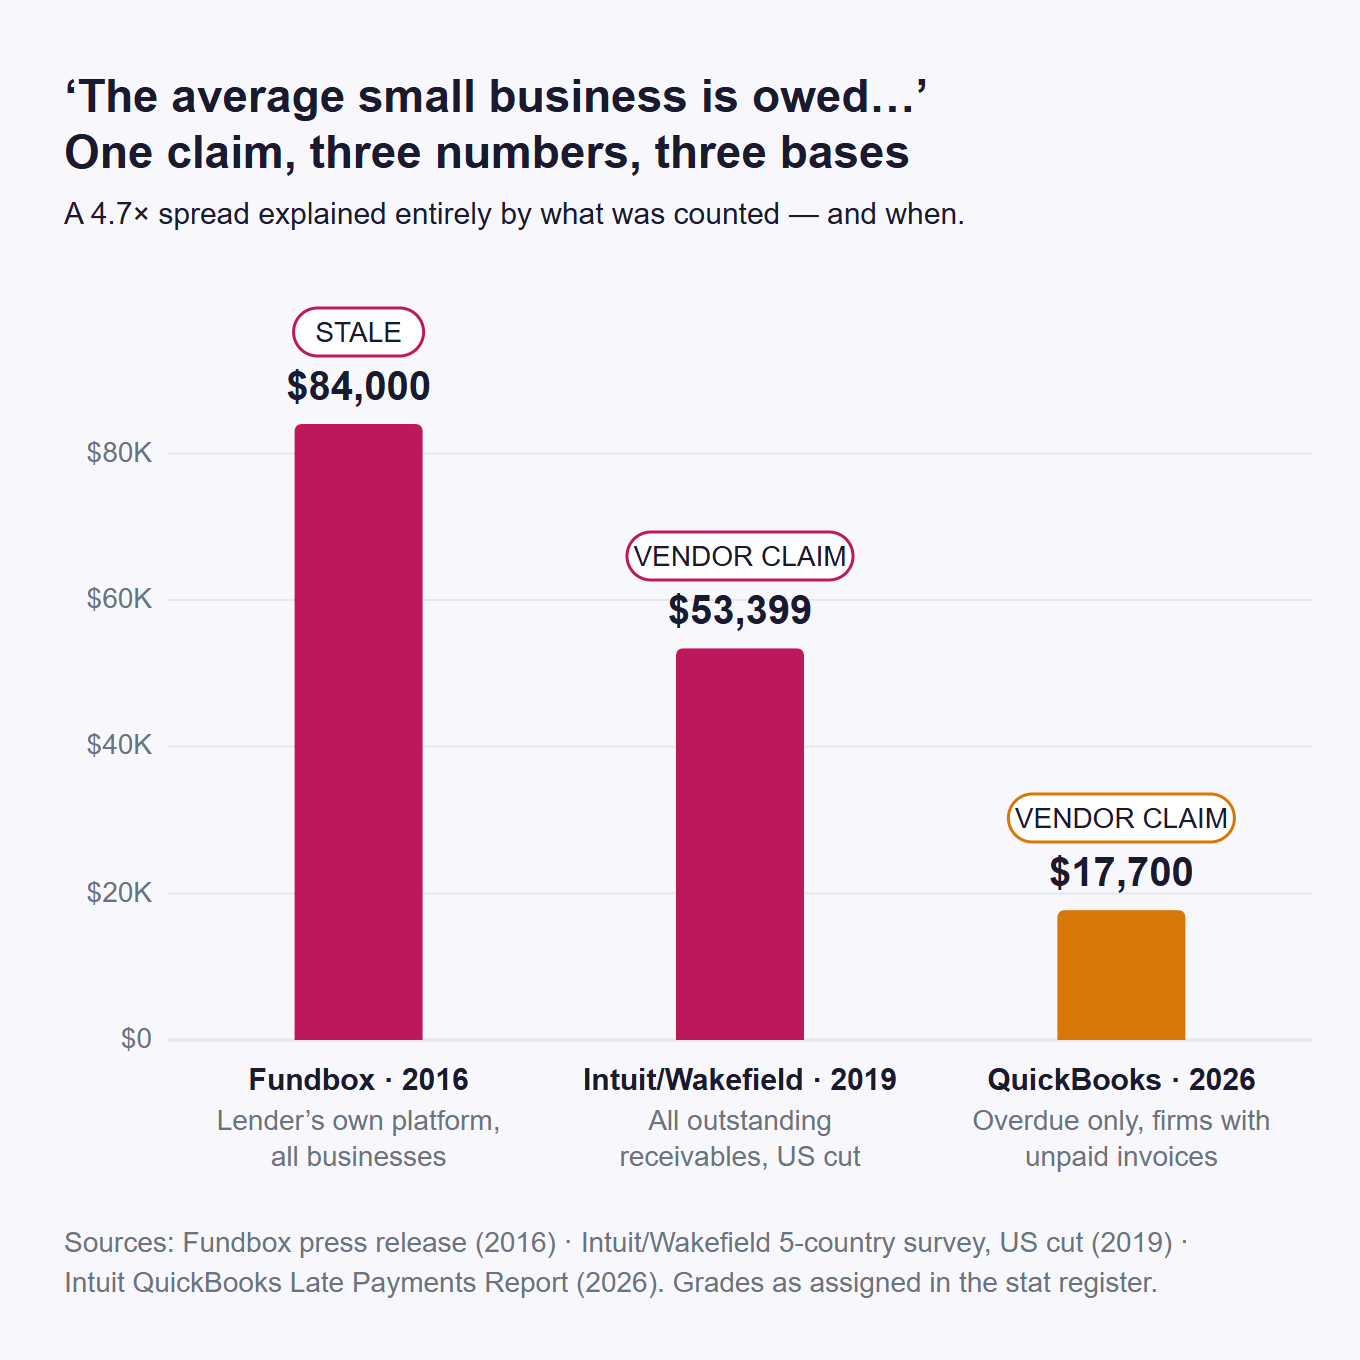
The same rot explains why “the average small business is owed…” comes in three sizes. Fundbox’s 2016 platform math put it at $84,000 per business. An Intuit-commissioned Wakefield survey put it at $53,399 in 2019, counting all outstanding receivables in the US cut of a five-country sample. QuickBooks’ 2026 report puts it at $17,700, counting overdue amounts only, among businesses that have unpaid invoices. That is a 4.7x spread explained entirely by base and vintage — and roundups quote whichever number is biggest with no base stated. State the base or skip the number.
Five numbers in this cluster earned a SOLID, counting the five-year closure rate above, and they tell a calmer story. Xero measures real accounting ledgers, not owner recall. Across 32,000+ US small businesses, its data shows an average 28.8 days to get paid, with invoices running 9.0 days late in the March 2026 quarter; the one caveat is that its base is cloud-accounting customers. Atradius’s 2025 barometer found 43% of US credit-based B2B sales overdue and 5% of long-overdue invoices written off, across B2B firms of all sizes, not just small ones. Its 2024 wave was the spike year, with about half of invoices overdue and bad debts at 8% of credit sales. Quote each wave with its year, or the series looks self-contradictory. And keep the bases apart: Xero’s 28.8 days covers all invoices, while the 20-day figure in Atradius’s 2024 wave averages late invoices only.
The strongest independent number is also the least quoted. The Federal Reserve Banks’ own small-business survey, published in the 2024 Report on Payments, found roughly four in five small firms face payments-related challenges. It is SOLID, it is DOI-citable, and it is nearly absent from the vendor listicles that quote everything above.
Not every STALE grade is a gotcha. JPMorgan Chase Institute’s finding that the median small business holds 27 cash buffer days came from 597,000 business accounts and 470 million transactions — real ledgers, at a scale nobody has matched since. But the analysis ran in 2016 on 2015 data, and no comparable public update exists, which is itself worth knowing. Always date it.
One last habit: round the aging numbers. Collection-industry surveys have long suggested recovery odds fall sharply as invoices age, to roughly two-thirds at three months and half at six. But the one-decimal versions in circulation have no source anyone can inspect, so treat them as DIRECTIONAL. In the end, measuring your own receivables beats citing anyone’s average, and when an invoice does go late, our escalation timeline for overdue invoices covers what to do about it.
Speed, replies, and reminders: the responsiveness numbers
This cluster splits clean in half. Five of its fourteen famous numbers have no source at all, the most UNTRACEABLE verdicts of any cluster here. Its four boring numbers, all peer-reviewed, are the best-evidenced statistics in the entire set. Almost nobody quotes them. The five ghosts first, one beat each.
- "85% of callers who don't get an answer never call back." We could not find any study. The same number gets credited to Forbes, BT, Google, and four different vendors on different pages. That attribution churn is the fingerprint of an invented statistic. UNTRACEABLE.
- "80% of callers sent to voicemail don't leave a message." No study we could find supports it. The only measured figures, one vendor's platform data and another's consumer survey, disagree by 14x. The round number floating between them is invention. UNTRACEABLE.
- "Missed calls cost the average small business $126,000 a year." This is arithmetic, not data: assumed call volumes times assumed deal values, with a 2016 miss rate as an input. Different pages show incompatible math arriving at the same viral total. UNTRACEABLE.
- "35-50% of sales go to the vendor that responds first." It appears fully formed and uncited on a sales-software vendor's 2010 blog as "sales studies consistently show." Later citers credit it to Google, CEB, and Harvard, none of which published it. Real studies report a number; folklore reports a range. UNTRACEABLE.
- "78% of customers buy from the company that responds first." Credited to a "Lead Connect survey" that was never published. The page most citations route through has quietly deleted the claim, and the chain ends in nothing. A real vendor survey did find 78% of consumers abandoned a business after an unanswered call. That is a different claim, and writers mix the two up constantly. UNTRACEABLE.
Then comes the "MIT study," which was neither. The 5-minute rule, with its famous 21x and 100x multipliers, is a 2007 conference deck by sales-software vendor InsideSales.com. The deck analyzed dial logs from six of the vendor's own customers, and its co-presenter was a researcher then visiting at MIT Sloan. It was never peer-reviewed, it is 19 years old, and it was never an MIT study. STALE. The direction, that faster is better, is plausible; the multipliers are the vendor's own odds curves. The defensible cousin is a 2011 Harvard Business Review audit of 2,241 companies: the average firm took 42 hours to answer a web lead, and about a quarter never replied. Also STALE, and co-authored by the same vendor's CEO, so the caveat stays attached.
The next chain retracted itself. Mobilesquared, the analyst firm behind the original 2010 "98% of texts are read," now estimates about 55% of SMS messages get read. The famous 98% is dead by its own author's account, and it usually arrives through a Gartner article that cited "various sources." The "90% read within 3 minutes" comes from the same retired 2010 paper. It predates WhatsApp and iMessage crowding the lock screen, and that crowding is the publisher's own explanation for why it no longer holds. Both STALE.
One more is real, just mishandled. The "62% of calls to small businesses go unanswered" line is everywhere, and it is a single 2016 monitoring study of 85 businesses by an SEO agency. Aggregators have started re-dating it as "a 2024 study." STALE, with the re-dating documented in its ledger row. If you want a miss rate you can trust, measure your own line for a week with the Missed-Call Audit instead of quoting a decade-old sample of 85.
What survives gets real space here, because it is the best news in this report. A 2018 systematic review of 105 studies put the average healthcare no-show rate around 23%, with long booking-to-appointment lead time the strongest predictor. A Cochrane review of 8 randomized trials found SMS reminders lifted attendance from 67.8% to 78.6%, matching phone-call reminders at roughly half to two-thirds the cost. A separate review of 29 studies found reminders cut non-attendance by about a third; that is the real citation behind every vendor's "up to 40%." All SOLID.
That last figure means even the wording is measurable. In those two 2015 NHS trials, one sentence naming the cost of a missed appointment cut no-shows from 11.1% to 8.4% — while a vague guilt message performed worse than the standard text. Four peer-reviewed anchors, and the vendors whose products they justify almost never cite them.
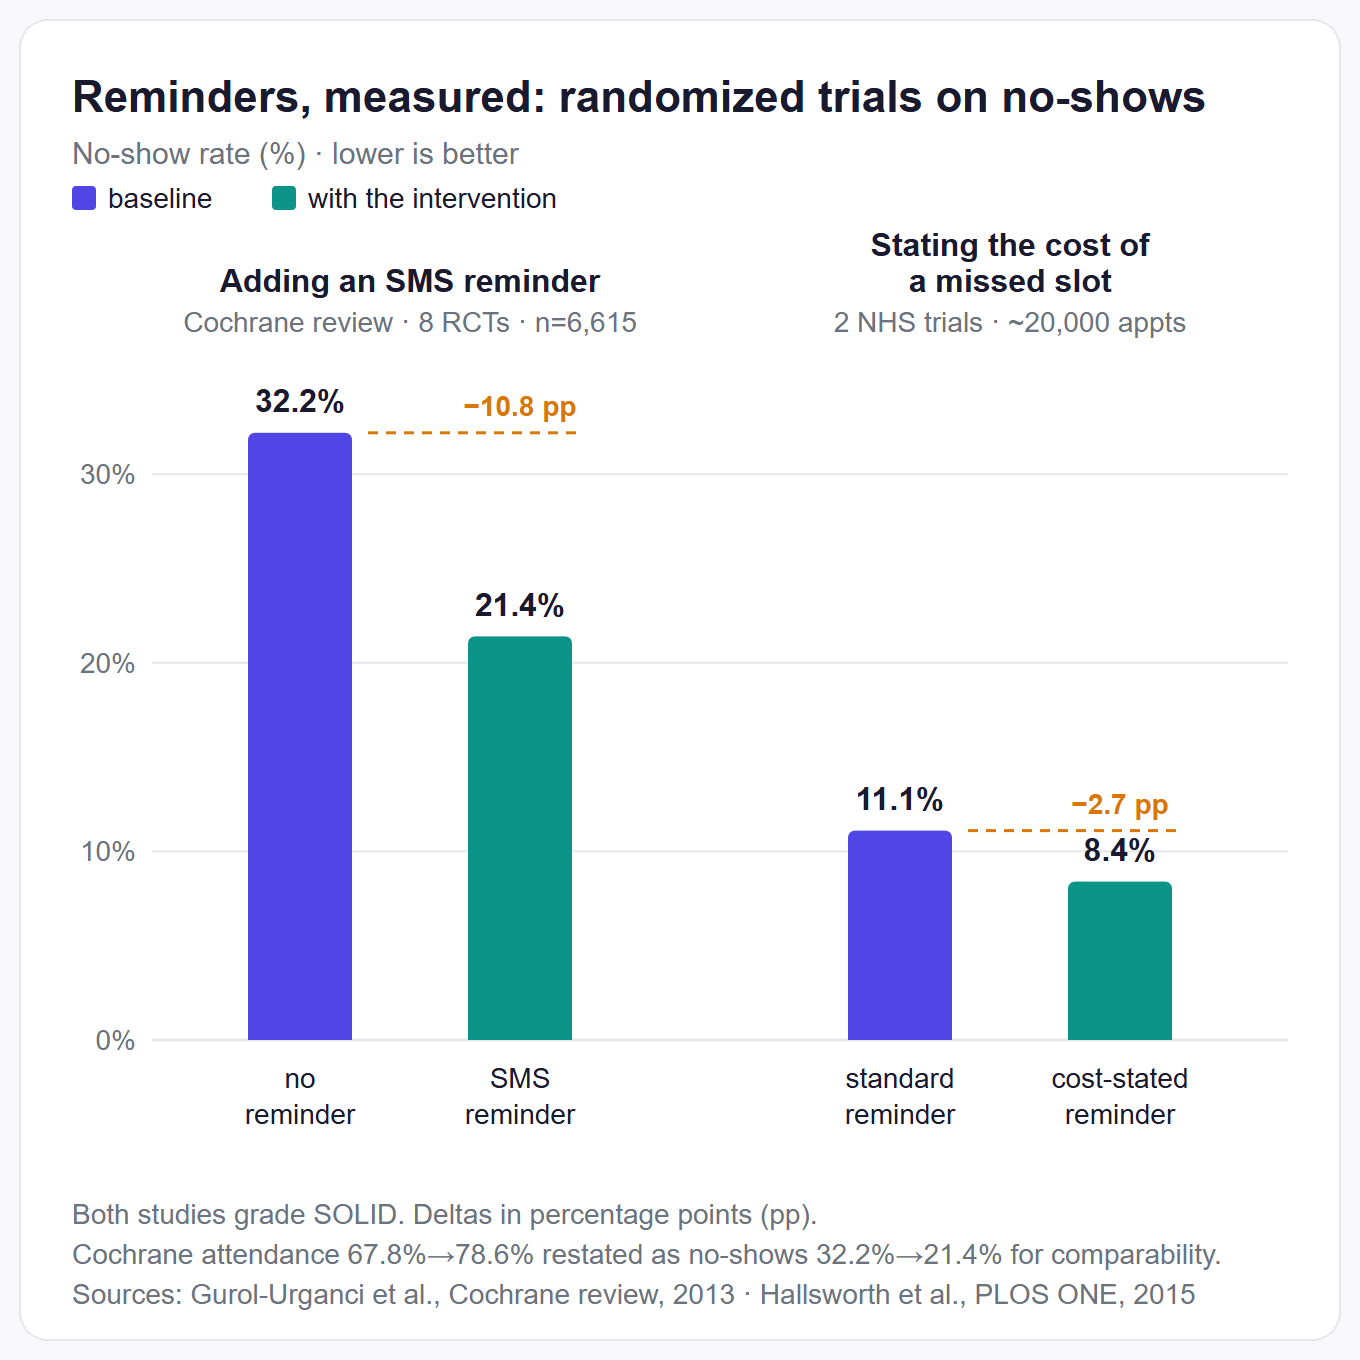
The pattern of this cluster is exact — the numbers with sources are modest and useful; the numbers without sources are spectacular.
What AI actually delivers: the outcome studies
This is the one cluster where genuinely strong evidence exists. Four randomized or quasi-experimental studies grade SOLID, in a report where the entire admin-time cluster produced none. The problem is not the research. The problem is which half of each study gets quoted.
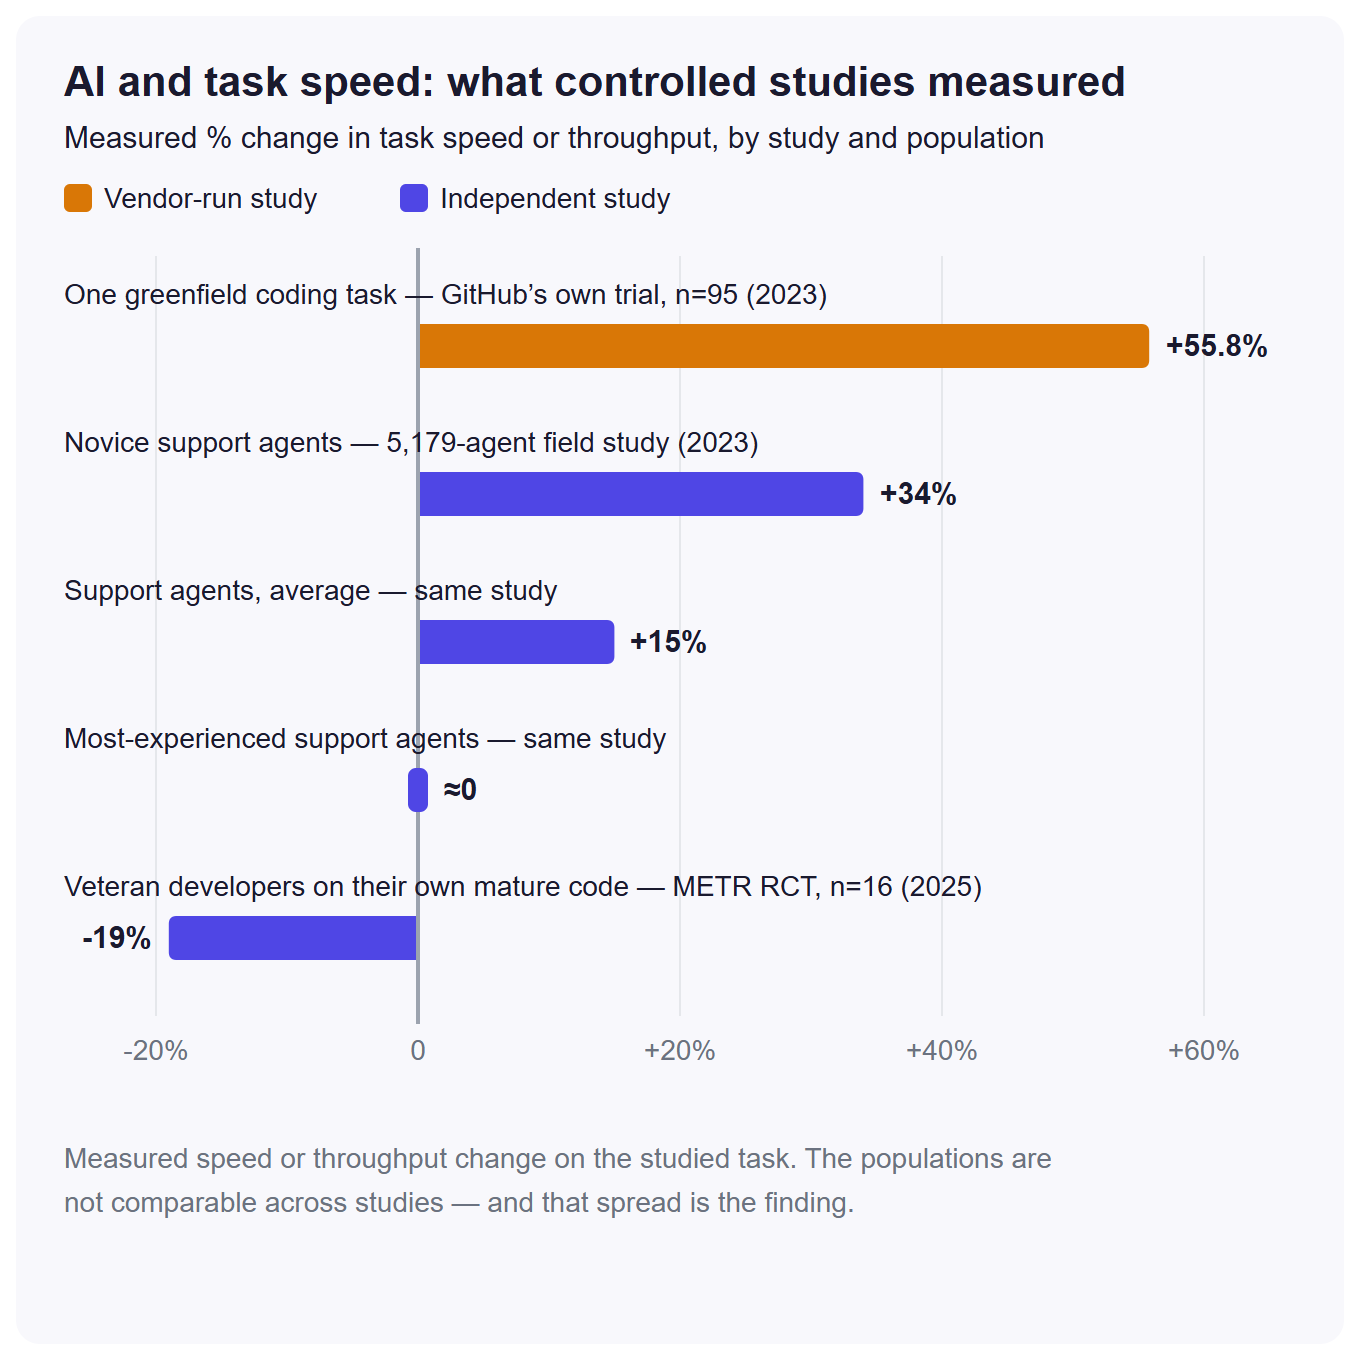
The strongest four first, each with its missing half. In a 2023 randomized experiment published in Science, 453 professionals using ChatGPT finished self-contained writing tasks about 40% faster with roughly 18% higher graded quality; that is a drafting-task result, not a whole-job multiplier. SOLID. In the largest real-world study of its era, an AI assistant helped 5,179 support agents at one company resolve about 15% more issues per hour on average and about 34% more for novices. The most experienced agents gained almost nothing. SOLID, and the zero is the half that gets dropped.
The BCG field experiment gave 758 consultants tasks with and without GPT-4. Inside the AI's competence, quality rose about 40%; outside it, consultants using AI were 19 percentage points MORE likely to get the task wrong — the half almost everyone amputates. SOLID. The lesson is the jagged boundary, not the 40%. The quietest result in the report comes last.
That gap between felt speed and measured speed discounts every self-reported time-savings figure in this report, including the vendor numbers below.
On to the famous failure number. "95% of AI pilots fail" comes from MIT Project NANDA's preliminary, non-peer-reviewed report, and the report does not say that. It says 95% of custom enterprise GenAI initiatives showed no measurable P&L return yet, while general-purpose AI tools were widely adopted and useful. "Fail" and "pilots" are both distortions of a sentence almost nobody quotes. DIRECTIONAL. MIT restricted the report's distribution after publication, so its ledger row names the document but cannot link it.
The Gartner pair gets quoted by both camps. The prediction that over 40% of agentic AI projects will be canceled by the end of 2027 is a forecast, not a measurement. The same June 2025 press release carries the boosters' favorite forecast: 15% of day-to-day work decisions made autonomously by 2028. Skeptics and sellers are cherry-picking opposite halves of one document. Gartner's companion estimate, that only about 130 of the thousands of self-described agentic-AI vendors have genuinely agentic products, ships with no published method; "agent washing" is the useful export, not the count. Both DIRECTIONAL.
"AI agents fail 70% of office tasks" inverts a benchmark. On Carnegie Mellon's TheAgentCompany, 175 long multi-step tasks in a simulated software company, the best agent of early 2025 fully completed about 30% on its own. Scores rise with each model generation. That measures a moving ceiling on long-horizon autonomous work, not a universal failure rate. DIRECTIONAL.
The vendor tier is thinner. GitHub's own 95-developer trial found Copilot users finishing one from-scratch coding task 55.8% faster, a vendor-run best case for well-specified work. VENDOR CLAIM. Microsoft's survey of 297 hand-picked early Copilot customers found 70% saying they felt more productive, with Microsoft-designed task tests measuring about 29% faster. VENDOR CLAIM. The Nielsen Norman Group's "66% productivity gain" is a 2023 average of three studies that measured different things in different units, so it mostly measures how averaging works. STALE. Accenture's "40% boost" is a 2016 macroeconomic projection for the year 2035, built a full generation before generative AI. STALE. PwC's "$15.7 trillion by 2030" has the same problem at global scale: it is a 2017 upper-bound scenario, "could contribute up to" in the report's own words, and PwC has since replaced it with a wider, more conditional range. Quote it with its year or not at all. STALE. Scheduling vendors round out the tier with homepage telemetry: Reclaim.ai credits its users with 7.6 extra focus hours a week, and Motion says projects finish 32% faster, with no control group and no study behind either number. Both VENDOR CLAIM.
If you want the day-to-day picture behind these task-level trials, our guide to what an AI executive assistant actually does covers it without the multipliers.
The Stat Ledger: all 70 claims, graded
The full ledger is below: all 70 claims we traced, each with its Evidence Grade, its year, and a link to the primary source where one exists. The tally: 17 SOLID, 12 DIRECTIONAL, 21 VENDOR CLAIM, 12 STALE, and 8 UNTRACEABLE. Every row carries its own anchor, ledger-a1 through ledger-e15, so you can point a citation at a single entry instead of the whole page.
How to read it: UNTRACEABLE rows say "No primary source exists." That cell is the finding, not a gap in our homework. Two rows say "primary not linkable": the document is named but restricted or blocked to fetchers, and the methodology section explains each case. A year of "none" means no dated origin was ever published. If you quote a row, quote its grade too.
| # | The claim as it circulates | Grade | Year | Primary source |
|---|---|---|---|---|
| A1 | 98% of small businesses use AI-enabled tools | VENDOR CLAIM | 2024 | Chamber/Teneo 2024 report |
| A2 | 40% use generative AI, up from 23% in 2023 | DIRECTIONAL | 2024 | Chamber/Teneo 2024 report |
| A3 | 58% of small businesses use generative AI (2025) | DIRECTIONAL | 2025 | Chamber/Teneo 2025 report |
| A4 | Only about 5% of U.S. businesses use AI | SOLID | 2024 | Census working paper 24-16 |
| A5 | About 1 in 5 U.S. businesses uses AI | SOLID | 2026 | Census America Counts, BTOS |
| A6 | Half of all work can be automated (McKinsey) | SOLID | 2017 | McKinsey Global Institute 2017 |
| A7 | Under 5% of jobs fully automatable; 60% of occupations partly are | SOLID | 2017 | McKinsey Global Institute 2017 |
| A8 | 75% of SMBs are at least experimenting with AI | VENDOR CLAIM | 2024 | Salesforce newsroom |
| A9 | 91% of SMBs with AI say it boosts revenue | VENDOR CLAIM | 2024 | Salesforce newsroom |
| A10 | 76% of small businesses use AI; 93% see positive impact | DIRECTIONAL | 2026 | Goldman Sachs press release |
| A11 | 68% use AI regularly, up from 48% | VENDOR CLAIM | 2025 | QuickBooks Insights, April 2025 |
| A12 | AI saves small businesses $273.5 billion a year | VENDOR CLAIM | 2023 | SBE Council release |
| A13 | AI saves owners 13 hours a week | UNTRACEABLE | none | No primary source exists |
| A14 | 66% use AI (2026), saving $500-$2,000 a month | VENDOR CLAIM | 2026 | Thryv 2026 survey release (primary not linkable) |
| B1 | Workers spend 28% of the workweek on email | DIRECTIONAL | 2012 | McKinsey Global Institute 2012 |
| B2 | Owners work twice as much as employees | UNTRACEABLE | 2006 | No primary source exists |
| B3 | Owners work an average 52 hours a week | STALE | 2005 | Wells Fargo/Gallup index |
| B4 | Owners work 49.4 hours, would rather work 41.7 | VENDOR CLAIM | 2016 | TAB survey via PRWeb |
| B5 | 40% spend 80+ hours a year on taxes ("per SCORE") | DIRECTIONAL | 2015 | SCORE release (NSBA data) |
| B6 | One in three spends 80+ hours a year on federal taxes | DIRECTIONAL | 2025 | NSBA 2025 Taxation Survey |
| B7 | 15 hours a week on financial admin | VENDOR CLAIM | 2020 | Starling Bank report (UK) |
| B8 | Nearly 5 hours per pay period on payroll taxes | VENDOR CLAIM | 2019 | Intuit press release |
| B9 | 120 working days a year on admin | VENDOR CLAIM | 2017 | Sage survey release |
| B10 | Entrepreneurs spend 36% of the workweek on admin | VENDOR CLAIM | 2023 | Time etc survey |
| B11 | Payroll still takes 1-10 hours a month with a provider | DIRECTIONAL | 2025 | NSBA 2025 Taxation Survey |
| B12 | Owners spend 68.1% of time working "in" the business | VENDOR CLAIM | 2016 | TAB survey via PRWeb |
| C1 | 82% of small businesses fail because of cash flow | UNTRACEABLE | none | No primary source exists |
| C2 | 59% have invoices 30+ days overdue, up from 47% | VENDOR CLAIM | 2026 | QuickBooks 2026 late-payments report |
| C3 | Average owed in unpaid invoices: $84,000 / $53,399 / $17,700 | VENDOR CLAIM | 2019 | Intuit/Wakefield 2019 release |
| C4 | 39% say one late payment made payroll hard to cover | VENDOR CLAIM | 2026 | QuickBooks 2026 late-payments report |
| C5 | US small businesses wait 28.8 days to be paid | SOLID | 2026 | Xero Small Business Insights |
| C6 | 43% of US credit-based B2B sales are overdue | SOLID | 2025 | Atradius barometer 2025 |
| C7 | Half of US B2B invoices are overdue | SOLID | 2024 | Atradius barometer 2024 |
| C8 | Small businesses are owed $825 billion in unpaid invoices | STALE | 2016 | Fundbox press release |
| C9 | 61% regularly struggle with cash flow | STALE | 2019 | Intuit/Wakefield 2019 release |
| C10 | The median small business holds 27 cash buffer days | STALE | 2016 | JPMorgan Chase Institute |
| C11 | Roughly 4 in 5 face payments-related challenges | SOLID | 2024 | Federal Reserve Banks report |
| C12 | 64% face delayed payments; suppliers wait 43 days | VENDOR CLAIM | 2024 | PYMNTS/Finexio report |
| C13 | 59% of SMBs experience late payments | VENDOR CLAIM | none | Melio blog post |
| C14 | Collection odds fall to 68.9% at 90 days | DIRECTIONAL | none | CCAA survey via ABC-Amega |
| C15 | About half of small businesses fail within the first five years | SOLID | 2025 | BLS Business Employment Dynamics, Table 7 |
| D1 | 62% of calls to small businesses go unanswered | STALE | 2016 | 411 Locals monitoring |
| D2 | 85% of unanswered callers never call back | UNTRACEABLE | none | No primary source exists |
| D3 | 80% of callers sent to voicemail leave no message | UNTRACEABLE | none | No primary source exists |
| D4 | Missed calls cost the average business $126,000 a year | UNTRACEABLE | none | No primary source exists |
| D5 | "MIT study": 5-minute response makes qualifying 21x likelier | STALE | 2007 | InsideSales conference deck |
| D6 | Companies take 42 hours to respond to a web lead | STALE | 2011 | Harvard Business Review 2011 |
| D7 | 35-50% of sales go to the first responder | UNTRACEABLE | 2010 | No primary source exists |
| D8 | 78% of customers buy from the first responder | UNTRACEABLE | none | No primary source exists |
| D9 | Text messages have a 98% open rate | STALE | 2010 | Mobilesquared retraction page |
| D10 | 90% of texts are read within 3 minutes | STALE | 2010 | Mobilesquared retraction page |
| D11 | About 23% of appointments end in a no-show | SOLID | 2018 | Dantas et al., Health Policy |
| D12 | SMS reminders raise attendance, matching calls at lower cost | SOLID | 2013 | Cochrane review, 8 RCTs |
| D13 | Appointment reminders cut no-shows by 30-40% | SOLID | 2011 | Hasvold & Wootton review |
| D14 | One sentence in a reminder measurably cuts no-shows | SOLID | 2015 | Hallsworth et al., PLOS ONE |
| E1 | Over 40% of agentic AI projects canceled by end-2027 | DIRECTIONAL | 2025 | Gartner press release |
| E2 | Only about 130 agentic AI vendors are real | DIRECTIONAL | 2025 | Gartner press release |
| E3 | AI agents fail about 70% of office tasks | DIRECTIONAL | 2024 | TheAgentCompany benchmark (arXiv) |
| E4 | ChatGPT makes workers 40% faster, 18% higher quality | SOLID | 2023 | Noy & Zhang, Science |
| E5 | AI made support agents 14-15% more productive | SOLID | 2023 | Brynjolfsson et al., NBER |
| E6 | Consultants with GPT-4: 25% faster, 40% higher quality | SOLID | 2023 | Dell'Acqua et al., HBS |
| E7 | MIT found 95% of AI pilots fail | DIRECTIONAL | 2025 | MIT Project NANDA (primary not linkable) |
| E8 | Developers complete tasks 55% faster with Copilot | VENDOR CLAIM | 2023 | Peng et al. (arXiv) |
| E9 | AI made experienced developers 19% slower | SOLID | 2025 | METR randomized trial (arXiv) |
| E10 | AI improves employee productivity by 66% | STALE | 2023 | Nielsen Norman Group article |
| E11 | AI can boost business productivity by 40% | STALE | 2016 | Accenture newsroom |
| E12 | AI scheduling saves 7.6 focus hours a week | VENDOR CLAIM | 2026 | Reclaim.ai homepage |
| E13 | AI project management finishes projects 32% faster | VENDOR CLAIM | 2026 | Motion homepage |
| E14 | 70% of Copilot users say they're more productive | VENDOR CLAIM | 2023 | Microsoft WorkLab |
| E15 | AI will add $15.7 trillion to the global economy by 2030 | STALE | 2017 | PwC, Sizing the Prize (2017) |
How we traced these numbers (and where we could be wrong)
The method was the same for all 70 claims, in four steps.
- We collected the automation statistics most often cited across ranking listicles, vendor blogs, and syndicated coverage.
- For each one, we followed its citation chain hop by hop until we reached a primary document or the trail died. When it died, we recorded the last live hop.
- We fetched every primary we cite. PDFs were text-extracted. Pages that block automated fetchers were loaded in a real browser: QuickBooks, Xero, the Fed's small-business site, and SCORE all block bots, which is one reason syndicated copies end up treated as the source.
- We graded each claim against what the primary document actually says.
Grades come from the five-grade scale defined in the Evidence Grade section. In short, the grade reflects who measured the number, how, when, and whether the document still says what the quote claims.
The final count: 70 claims across five clusters. Seventeen graded SOLID, 12 DIRECTIONAL, 21 VENDOR CLAIM, 12 STALE, and 8 UNTRACEABLE. This report contains no first-party data of any kind. No Praxivara numbers appear anywhere in it. The original work here is the tracing and the grading, nothing else. We do sell automation software, which means the grading cut against our own industry's favorite numbers, and that is the point.
How the claims were selected
The claim set came from reading what people actually encounter: high-ranking articles, vendor marketing pages, and syndicated coverage across the five topic clusters. A claim qualified when it kept recurring across independent outlets. That makes the set an editorial selection, not a measured citation census, which is why we say "widely cited" rather than "most-cited."
What the grades mean, and what they do not
The Evidence Grade is a practical citation label. It blends research quality, provenance, recency, and how faithfully the popular quote matches the source. It is not a formal risk-of-bias instrument.
STALE is assigned when the age of the evidence changes how a reasonable reader would take the claim. The threshold moves with the subject: adoption figures and technology benchmarks age in a year or two; structural business data ages slowly.
SOLID does not mean universal or permanent. It means the primary evidence is accessible, the method is stated, and the quoted claim represents it fairly.
Where we could be wrong
Five limitations, stated plainly.
- An UNTRACEABLE grade means we could not find a primary source anywhere fetchable. It is not proof that none ever existed.
- Grades are judgments. Reasonable people could move a claim one grade in either direction.
- The claim list is our editorial selection, not a census of every claim in circulation.
- Two primaries could not be linked: one was restricted after publication, and one is available only through syndication. Both are marked in the ledger.
- This page will itself go stale. The verification date below is part of every citation.
Last verified July 30, 2026 (Eastern Time). Every link and quote was checked against its primary source on that date. No study author or vendor named in this report endorses it, and none is affiliated with us.
Corrections and updates
Version 1.0, published July 30, 2026. No corrections have been issued. If we got a grade, a quote, or a link wrong, tell us at the Praxivara help center and we will fix the row and log the change here.
To cite this report: The 2026 Small-Business Automation Report, Praxivara, July 2026, praxivara.com/blog/small-business-automation-report. To cite one claim, link its row anchor in the ledger so your readers land on the grade, not just the number.
What this means if you run a small business
The practical rule from 70 traces is short. Before a statistic moves your money, ask who measured it, when, and whether the measurer sells the fix. If the answer is a vendor's undated survey of its own customers, you are looking at marketing with a decimal point.
So which numbers should actually change what you do? The short list is the SOLID one. Payments really are slow, and worth building a system around. The Federal Reserve Banks' own 2024 survey found roughly four in five small firms face payments-related challenges. Xero's ledger data across 32,000-plus US small businesses shows an average 28.8 days to get paid. Reminders really work: across randomized trials, they cut no-shows by about a third. And the AI evidence points both ways at once. In a 2023 randomized experiment in Science, ChatGPT cut time on self-contained writing tasks by about 40% for 453 professionals. In a 2025 METR trial, veteran developers were 19% slower with AI on code they knew cold — while believing they had been about 20% faster. The measured wins sit on drafting-shaped tasks, not on expert work.
Notice what those findings share: not one of them is about your business. Even a SOLID number is an average of other people's shops. Your days-to-paid and your no-show rate already sit in records you keep, and a week of counting them beats any statistic in this report, including the good ones. Earlier sections pointed to ways of running those counts. And when you reach the question of which tasks are worth handing off at all, the Green-Light Grid scores any task in two questions.
This is the only product paragraph in the report. We make Praxivara, an AI assistant for small businesses, so we sell the kind of software these statistics get used to sell. This report exists because our industry's sales math runs on numbers like the ones graded above, and we would rather compete on evidence. If you evaluate us, or anyone else, apply the test you just watched us apply: ask the vendor which of their claims is a measurement and which is a survey of their own customers.
Take the ledger with you: download the full report as a PDF. It is free, with no email and no form. Prefer raw data? Download the full ledger as CSV.
If you want to look at the product behind this report, see what Praxivara actually does. Judge it by the same test.
Questions writers and owners keep asking
What percentage of small businesses use AI?
Roughly 18-20% on representative Census data from winter 2025-26, and under 20% for firms with fewer than 20 employees (SOLID). Self-selected surveys run far higher: 58% self-reported generative-AI use in the Chamber/Teneo 2025 online panel and 76% among Goldman Sachs accelerator alumni, both DIRECTIONAL. The gap is sampling and question wording, not contradiction.
Is the "82% fail because of cash flow" statistic real?
No. It grades UNTRACEABLE: we could not find any U.S. Bank study, SCORE's own archived stats pages never carried it, and attributions cannot agree on the decade. The full trace is at the 82% ledger entry. Instead, cite Intuit's 2026 QuickBooks survey, a VENDOR CLAIM with disclosed methodology: 39% of owners said one late payment made payroll or bills hard to cover.
Why do automation statistics vary so much between sources?
Four things explain almost every spread: who got sampled, how the question was worded, who paid for the survey, and how old the number is. That is how "small businesses using AI" lands anywhere from roughly 20% to 76% in the same year. The Evidence Grade exists to carry those four answers along with every stat.
How much time does automation actually save a small business?
No defensible universal number exists. Universal hours-per-week figures trace to sellers surveying their own users, and the most famous, "13 hours a week," grades UNTRACEABLE: we could not find any study that states it. The measured evidence is task-level and SOLID on both sides: a 2023 randomized trial found self-contained writing tasks about 40% faster with AI; a 2025 trial found experienced developers 19% slower. Savings depend on the task.